Watch a replay of the webinar here, or scroll down for a summary and a preview.
Your sustainability information can be complex. How can you present it clearly and in a way that avoids claims of greenwashing? Design and graphics help your audience read your sustainability report, interpret results, and understand complicated industrial processes.
Caroline Noordijk, our thinkstep-anz Head of Creative presents this webinar. Caroline leads our team to produce infographics, Nutshells (short-form reports), sustainability and climate disclosure reports, and the visual look of our documents and presentations.
Caroline joined Sally-Anne Käsner, our Senior Circular Economy and Strategy Specialist. Caroline and Sally shared examples of our design work, including Nutshell reports, case studies and our Need to Know guides.
 |
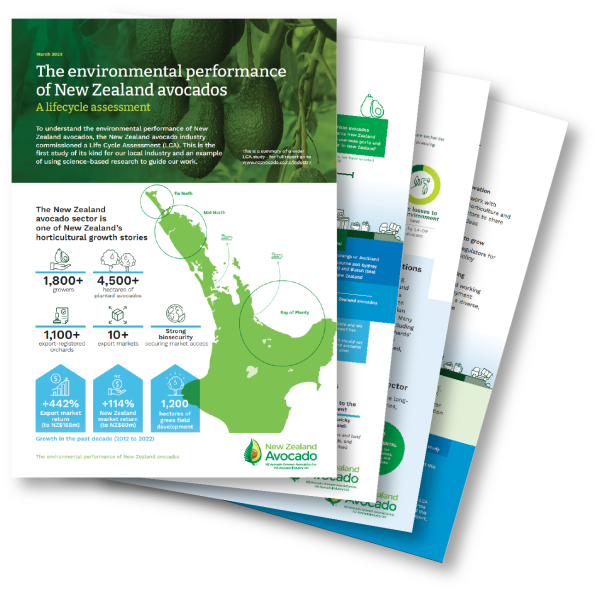 |
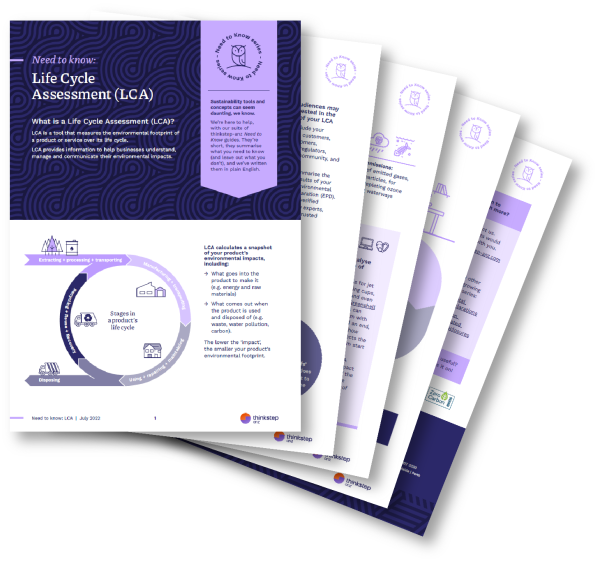
Examples of our design work: our Environmental Product Declaration Need to Know and the life cycle of New Zealand-grown avocados.
Here's a preview of the webinar
In the webinar Caroline shared these tips:
- Identify your audiences and their needs
- Focus on what matters: confirm a few core messages
- Simplify your technical concepts
- Create a visual hierarchy to highlight your core messages
- Connect content to show the links
- Use plain English messaging supported by design to avoid greenwashing (in its many forms!)

